Messenger-to-messenger testing. How to test messenger-to-messenger voice and video calls?

This is how you can learn about your customers experience during the audio / video calls and find thin points and bottle necks in your service.

No call recordings, no privacy violation, but full details on the user quality of experience: low types of MOS scores (QoS and QoE), reasons for call quality degradation, pinpoints at the parts of the call audio where the quality had issues.

We promise easy and flexible integration into your messenger.


Do you have a hardware solution that records RTP call traffic in real-time? Enable QoE analysis to real-time RTP recording.

Are you happy with the E-Model quality scoring? Try out our user experience metrics. This will give you a competitive advantage and won’t take much effort for integration. Matching network conditions (E-Model, packet loss etc) with user experience (our analysis is based on actual call audio) will give you full picture on your network and user quality of experience (QoE).

Call quality issues maintenance prior your cusotmers complain

Do you want to know about call quality issues prior your customers start complaining?

Sevana libraries collect all the QoS and QoE data of the calls in real-time, providing immediate alerting on changes that affect callers’ perception, and discover and store reasons for call audio degradation. Map audio impairments on network metrics and discover QoE and QoS patterns, specific to certain routes, destinations, originations, or parts of the traffic.

Every call, analyzed by the system, creates big data that one can study, using data analysis tools, to predict network behavior and call quality.

End-to-end audio quality testing: is there a simple but powerful tool for end-to-end audio quality testing and file comparison?

Meet Sevana AQuA – Audio Quality Analyzer 🔉
It is a simple but powerful tool to provide perceptual voice quality testing and audio file quality comparison.
The human ear is a non-linear system, which produces an effect named masking. Masking occurs on hearing a message against a noisy background or masking sounds.
AQuA perceptual model is based on research of four different scientists who discovered influence of different frequency bands (the so-called critical bands) to human perception.
The value of spectrum energy in frequency bands can be used for different purposes; one of which is the sound signal quality estimation.
However, using only critical bands discovered by one scientist does not allow getting an estimation objective enough, since they show only one of the aspects of perception or speech production.
AQuA can determine energy in various critical bands as well as in logarithmic and resonator bands, that allows taking into account more properties of hearing and speech processing.
We know three tools of this kind available on the market: POLQA, ViSQOL, AQuA. Please contact us if you know other tools or like to evaluate Sevana AQuA.

Real-time network statistics and KPIs one can benefit from using PVQA Server

Learn about network MOS and variety of waveform KPIs related to impairments that affect voice quality in real-time
📞 Agility
Add proactive maintenance layer based on PVQA call quality monitoring and let your support engineers be notified when call quality issues prevail in conversation
⠀📞 Quality issue root-cause discovery
Based on impairments analysis speed up problem root-cause identification, discover packet loss patterns inside the call audio
⠀📞 Flexible setup
Integrate PVQA library into existing system or create a new one suitable for any hardware and OS
Keep an eye on call quality with Sevana!

Caller quality of experience measurement. Do you know about issues bothering your callers that you might not know?

Sevana PVQA technology detects these impairments to predict caller’s quality of experience aside from network quality of service:

💡 Silent Call – one leg of the voice call has no speech (silentcall)

💡 Echo – this is typically due to a blockage or mismatch, which results in the signals bouncing back from where they came. Additionally, the presence of echo effect in packet switched networks can be traced back to the functionality of the line. Where standard lines function with a delay of 10 milliseconds, packet switched networks can have up to 400 milliseconds of delay. As a result, the echo effect is much more noticeable.

💡 Amplitude clipping – is typically a result of a misconfigured voice gateway on the voice path.

💡 Dynamic clipping – notifies about possible clipping happening in another network as the audio waveform corresponds amplitude clipping, however, it is not present at the moment.

These and other impairment detectors allow you an effective caller quality of experience measurement. Contact us to learn more.

How to make mobile test call from one mobile phone to another?
Using Sevana QualTest it is easy:

✅Measures quality of mobile calls with regular non-rooted Android phones and iPhones
✅Enables uploads and shares test results
✅Runs both active (with reference audio) and passive tests
✅May be integrated with QualTest Host and correspondent Backend to automate making and receiving mobile test calls
✅Measures quality of mobile calls in the field
Within QualTest one can easily setup these two test scenarios:
🔊 initiate test calls and measure MOS when installed as system application. It is available on rooted phones only. One can view / share / upload test results right from the phone.
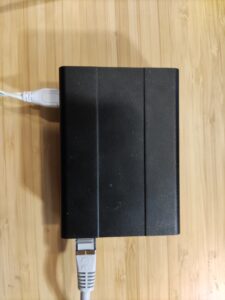
🔊 initiate and accept calls without analysis on mobile phone. Rooted phone is NOT required. In this mode application notifies its desktop (Raspberry Pi) counterpart (Qualtest Host, further down QH) about progress of the call. QH handles audio streams via cable adapter and communicates with backend.


What are Sevana call quality testing offerings?
We are happy to offer all kinds of tools to test call quality in any network: VoIP, GSM, 5G, satellite
🔹 Vast call quality monitoring both on audio and protocol levels
🔹 Passive real-time and active scheduled call quality analysis
🔹 Call quality problem root cause analysis
🔹 Reliable network and payload MOS
🔹 Mobile-to-mobile call quality tests

contact center end-to-end voice quality testing
Contact Center end-to-end voice quality testing value clients and agents

Forecasting voice quality using network statistics was sufficient for the days when one could control the network.

Different suppliers, networks, systems, software, hardware influence customer and agent experience. Only network metrics cannot ensure that all entities involved in the voice path work properly and give the best or satisfactory quality of caller experience (QoE).

Using network parameters to calculate MOS for cloud-based contact center and agent connection does not represent possible issues inside the cloud or voice paths connected to it.

Automation of test calls simulating caller and agent activity that will play audio file of “excellent” quality (the so-called reference audio) over the environment and record actual audio received by correspondent endpoints will give objective quality score for the whole voice path if one can compare the reference and test files for quality loss.

Sevana AQuA makes this comparison fast and easy providing reliable MOS score and reports on various quality issues that affected the caller perception. Furthermore, AQuA will pinpoint timestamps of the conversation where the problems occurred and indicate the type of impairment, which will help to identify the “faulty” part of the voice path.

This approach is useful at any stage of deployment – evaluation, piloting, transition, or production. If on demand, or scheduled voice quality scoring is not enough one can use Sevana PVQA for real-time voice quality analysis, problems alerting and reporting within the same feature of indicating impairments that affected the quality loss, but in real time.

Waveform analysis is the approach that gives objective overview on voice quality in cloud contact centers. Sevana tools perform perfectly well for voice quality measurement and analysis in the cloud.