Introduction
In today’s fast-paced digital world, reliable mobile communication is crucial as well as enhancing mobile call quality. Mobile operators are constantly striving to provide their customers with seamless and high-quality call experiences. However, technical challenges such as silent calls, random echo, and short calls can significantly degrade the quality of service, leading to customer dissatisfaction. This case study explores how a leading mobile operator overcame these challenges by integrating Sevana PVQA Server into their existing call quality monitoring system.
The Challenge
The mobile operator in question was facing significant issues with call quality. Customers frequently reported experiencing silent calls, unexpected echo, and abrupt disconnections. Despite having an existing call quality monitoring system in place, the operator struggled to detect and diagnose these specific impairments. The limitations of their monitoring tools meant that many problematic calls went unnoticed, leaving the operator unable to address the root causes effectively.
Silent Calls
Silent calls occur when a call connects, but one or both parties cannot hear anything. This issue can be caused by network problems, faulty equipment, or software bugs. Silent calls not only frustrate customers but also increase the likelihood of them switching to a competitor.
Random Echo
Echo during a call can be highly disruptive. It typically results from network latency or misconfigured equipment. Echo can distort communication, making conversations difficult and leading to a poor user experience.
Short Calls
Short calls, where the connection drops unexpectedly after a brief period, are another significant issue. These interruptions can be caused by network instability, interference, or software errors. Frequent short calls can erode customer trust and loyalty.
The Solution: Sevana PVQA Server
To address these persistent issues, the mobile operator decided to implement Sevana PVQA Server as an additional module to their existing call quality monitoring system. Sevana PVQA Server is a sophisticated tool designed to analyze and monitor voice quality, providing detailed insights into various call impairments.
Implementation Process
The integration of Sevana PVQA Server was seamless and required minimal disruption to the operator’s existing infrastructure. The system began to work alongside the existing monitoring tools, augmenting their capabilities with advanced voice quality analysis.
Identifying Problems
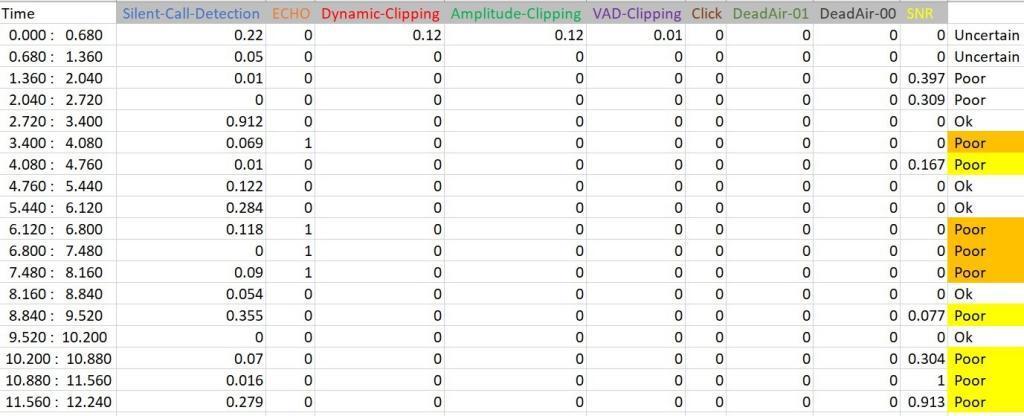
Sevana PVQA Server quickly proved its value by identifying numerous instances of silent calls, echo, and short calls that had previously gone undetected. The system’s detailed analytics provided the operator with precise data on when and where these issues occurred, enabling them to pinpoint problematic areas within the network.
Root Cause Analysis
Armed with comprehensive data from Sevana PVQA Server, the operator conducted a thorough root cause analysis. They discovered that many silent calls were due to faulty network equipment, while echo issues often stemmed from improper configurations in their voice routing system. Short calls were primarily attributed to network instability in specific regions.
Resolving the Issues
With clear insights into the root causes, the operator took targeted actions to resolve the issues. They replaced malfunctioning equipment, reconfigured voice routing settings, and strengthened network stability in identified trouble spots. The proactive measures led to a significant reduction in call impairments.
Results and Benefits
The implementation of Sevana PVQA Server yielded impressive results. The mobile operator experienced a marked improvement in call quality, with a notable decrease in customer complaints regarding silent calls, echo, and short calls. Enhanced call quality monitoring allowed the operator to maintain higher service standards and improve customer satisfaction.
Increased Customer Satisfaction
With fewer call quality issues, customers enjoyed a more reliable and pleasant communication experience. This improvement in service quality helped in retaining existing customers and attracting new ones.
Operational Efficiency
By accurately identifying and addressing call impairments, the operator optimized their network operations. This efficiency not only reduced operational costs but also minimized the time and resources spent on troubleshooting.
Competitive Advantage
The proactive approach to call quality gave the mobile operator a competitive edge. Demonstrating a commitment to high-quality service reinforced their market position and brand reputation.
Conclusion
This case study highlights the critical role of advanced call quality monitoring tools like Sevana PVQA Server in enhancing mobile communication services. By effectively identifying, analyzing, and resolving call impairments, the mobile operator was able to significantly improve call quality and customer satisfaction. This successful implementation underscores the importance of investing in robust monitoring solutions to maintain high standards of service in the competitive telecom industry.
For more information about Sevana and our innovative products, Contact Us.

 Network operators may reduce network operations costs by up to 65% using automation at the IP domain layer.