VQ Monitor for Asterisk brings Sevana’s real-time call quality monitoring inside your PBX. Load one module, res_vq_monitor.so, and Asterisk starts scoring the media of every call it carries: network MOS from packet loss and jitter on every stream, and Sevana’s perceptual PVQA MOS on the calls you choose. The results appear in a web dashboard and REST API that the module starts and supervises for you, with no separate probe, mirror port or monitoring server to install.
Request a demoTalk to us about licensing
Asterisk call quality monitoring with one module load
The module embeds the same engine as the standalone VQ Monitor server. It watches the PBX’s own network interfaces like a packet sniffer, so it never sits in Asterisk’s channels or media path. If the engine ever stalls, calls carry on unmonitored. Run on the same calls side by side, the module and the standalone server produced identical network MOS and identical Sevana MOS on every stream.
Two MOS scores per stream
Network MOS (ITU-T G.107 E-model) shows what the transport delivered; Sevana MOS (PVQA) shows what the caller actually heard. When the two disagree, the gap itself points to the cause.
Passive and isolated
Capture runs through libpcap on the PBX’s interfaces. The module’s libraries are linked privately, so they cannot clash with the ones Asterisk uses, and calls are never touched.
Dashboard included
The module starts the VQ Monitor dashboard as a supervised child process, restarts it if it exits, and stops it on unload. Because it is a separate process, a dashboard fault cannot take the PBX down.
Operated from the Asterisk CLI
vq show status reports the engine, capture counters and dashboard. vq track add picks the calls that get perceptual scoring and audio recording.
How the module works
Inside the Asterisk process, the VQ Monitor engine captures SIP and RTP, ties every RTP stream to its SIP call (caller, callee, Call-ID), computes network MOS, and decodes audio for PVQA analysis. It publishes per-stream and per-interval reports on a local ZeroMQ bus. The dashboard process subscribes to that bus, stores the results in SQLite, and serves the web UI and REST API. The bus uses the same documented schema as the standalone server, so your own tools can subscribe to it as well.
Asterisk process
 ├─ chan_pjsip / RTP              calls, untouched by the module
 └─ res_vq_monitor.so
     ├─ VQ Monitor engine         libpcap capture → SIP + RTP → network MOS, PVQA
     │                            → ZeroMQ reports (loopback)
     └─ supervisor ──fork──►  vq-db: SQLite, dashboard, REST API (loopback)
                                        ▲
                     reverse proxy with authentication ── your users
Choose which calls get perceptual scoring
Every stream gets network MOS, jitter and loss. Sevana MOS needs the audio decoded, and decoding is where the CPU goes, so the module decodes only some streams. With an empty track list, it scores the first streams in progress up to a limit you configure (for example, 32 at a time). Add a pattern, such as a SIP address or Call-ID, and the module scores and optionally records only the calls that match, including calls already in progress. Clear the list to return to automatic scoring.
*CLI> vq track add 1002@
Added 1 pattern(s).
*CLI> vq show track
1002@
*CLI> vq track clear
Track list cleared.
The dashboard’s Track list page edits the same list, so support staff can capture a problem extension’s calls without shell access to the PBX.
Audio recorded on request, statistics kept always
Call statistics take a few hundred bytes per stream, while decoded audio takes about 1.3 MB per stream for every 10 seconds. That is why recording is a separate choice: false never records, tracked records only the calls on the track list, and true records every decoded stream. Statistics and recordings expire on separate schedules, for example 14 days of statistics and one hour of audio, so disk use stays bounded.
Dashboard, SIP call analytics and REST API
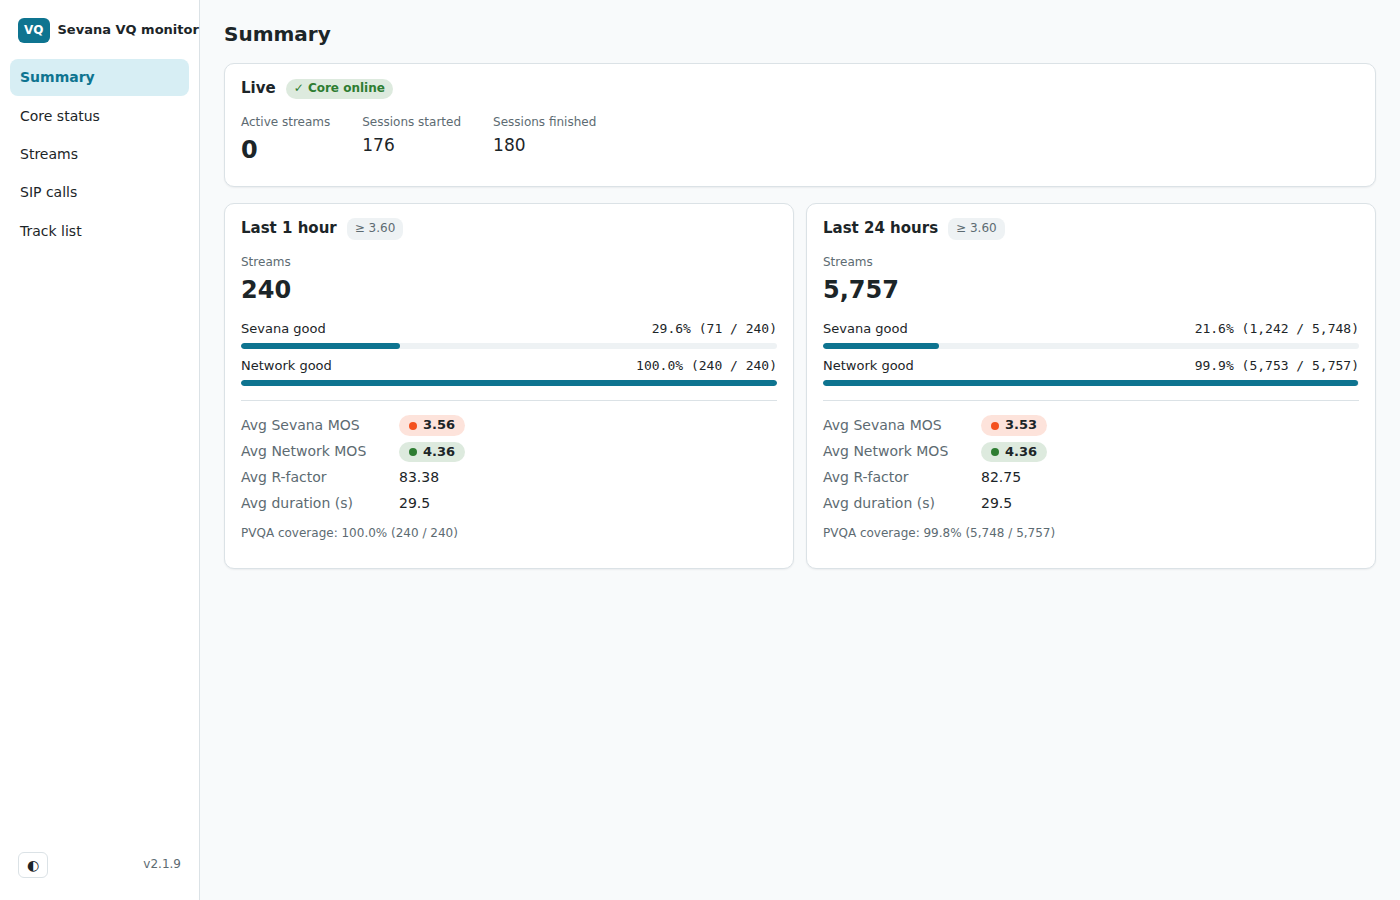
- Summary: live stream count, and for the last hour and last 24 hours the share of good streams, average Sevana MOS, network MOS and R-factor, and PVQA coverage.
- Streams: one row per RTP stream, with filter expressions such as
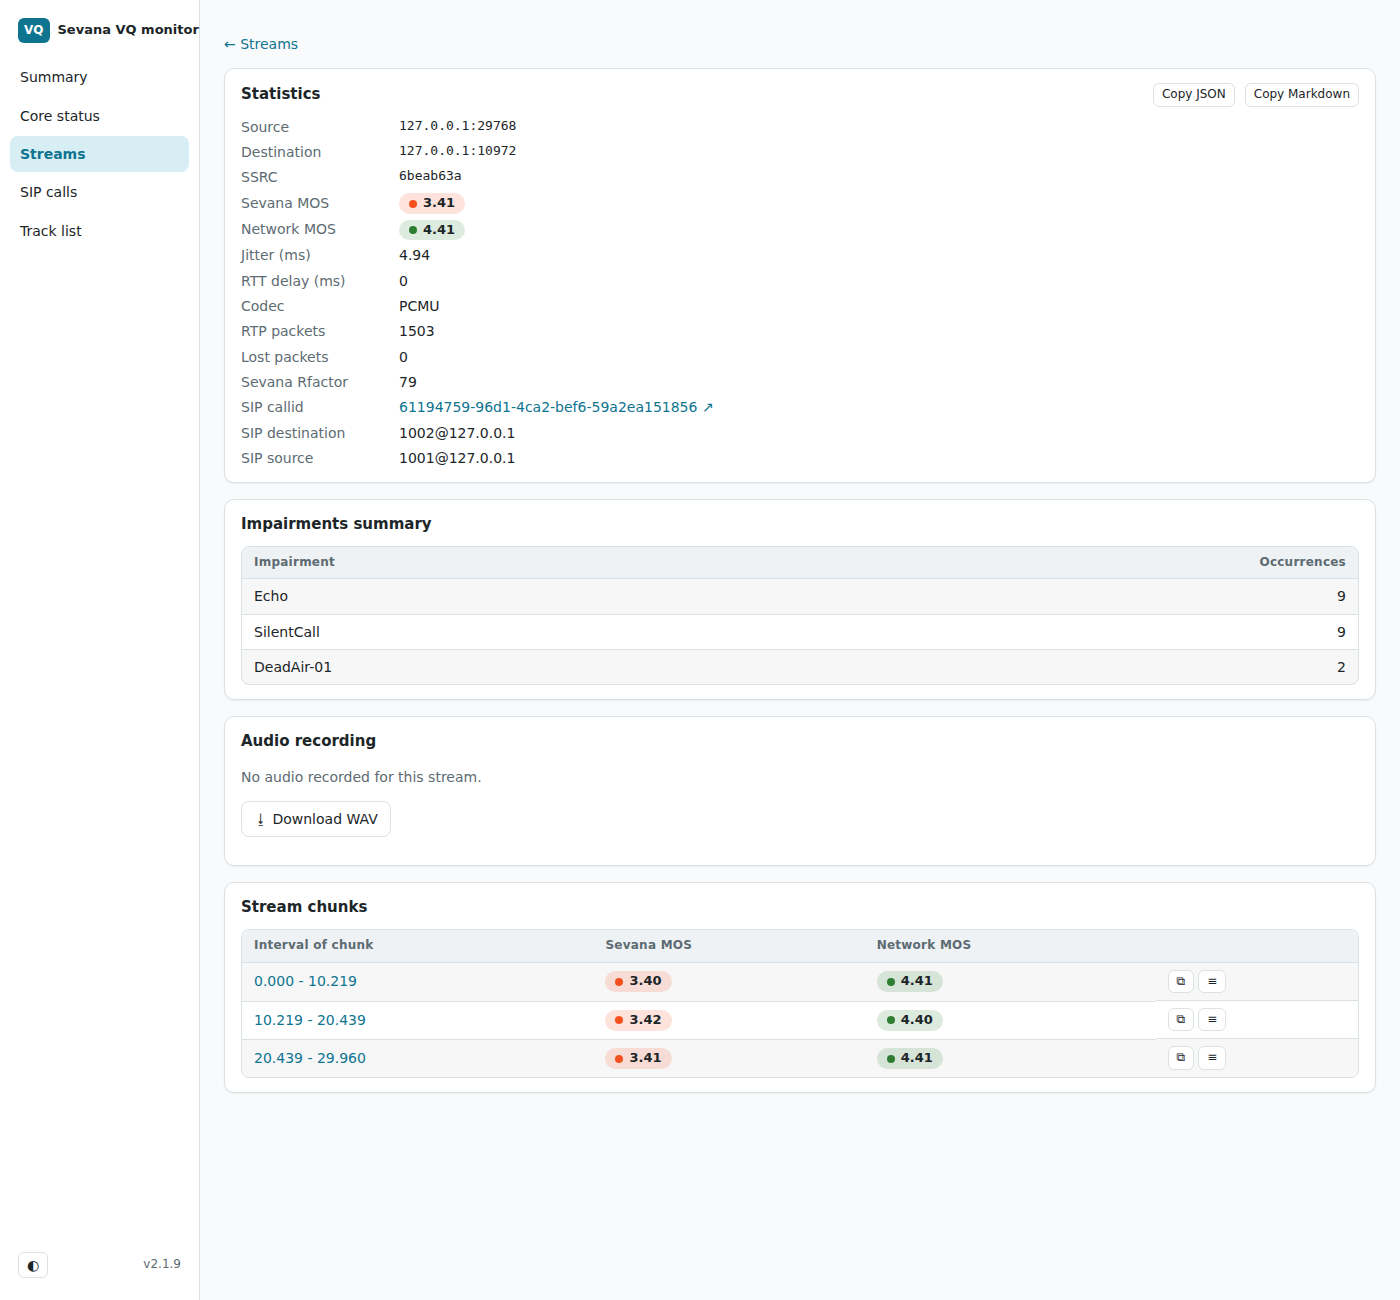
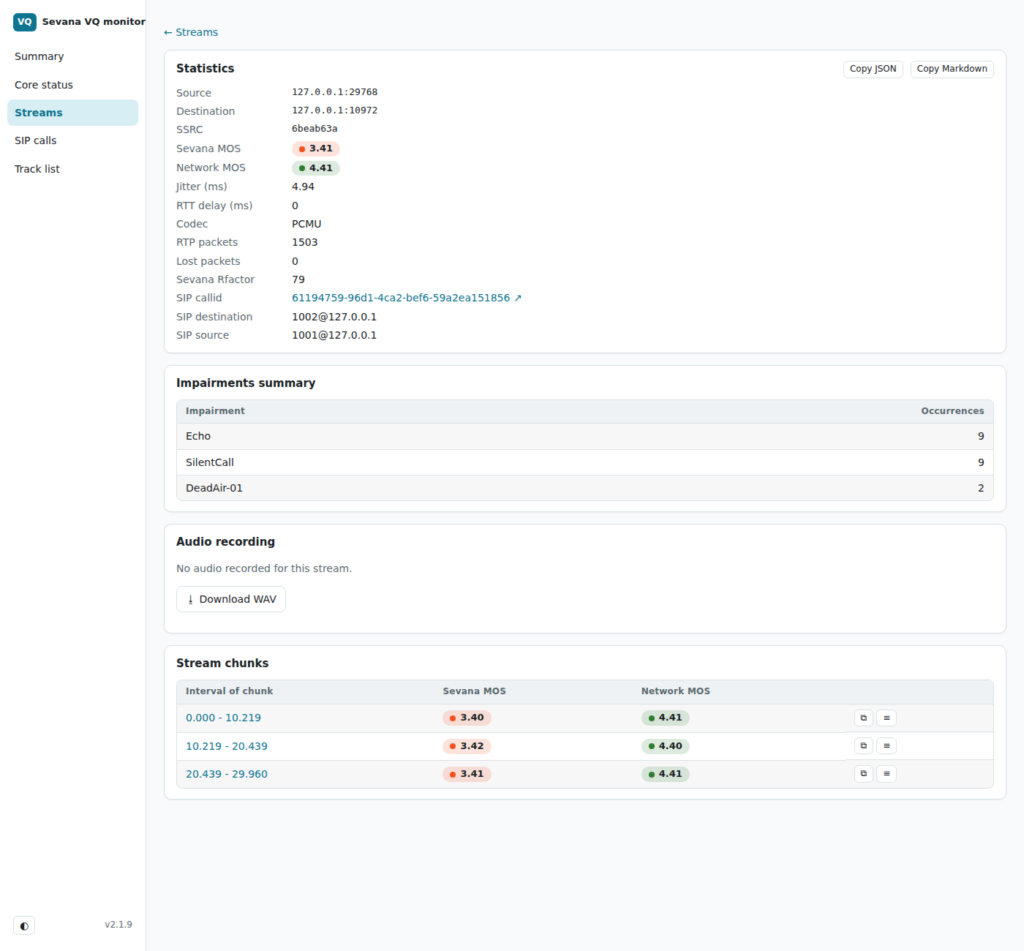
sevana_mos < 3.6 && jitter > 20and CSV export. - Stream detail: codec, packets, loss, jitter, both MOS scores, detected impairments (echo, silence, dead air), per-interval scores and any recorded audio.
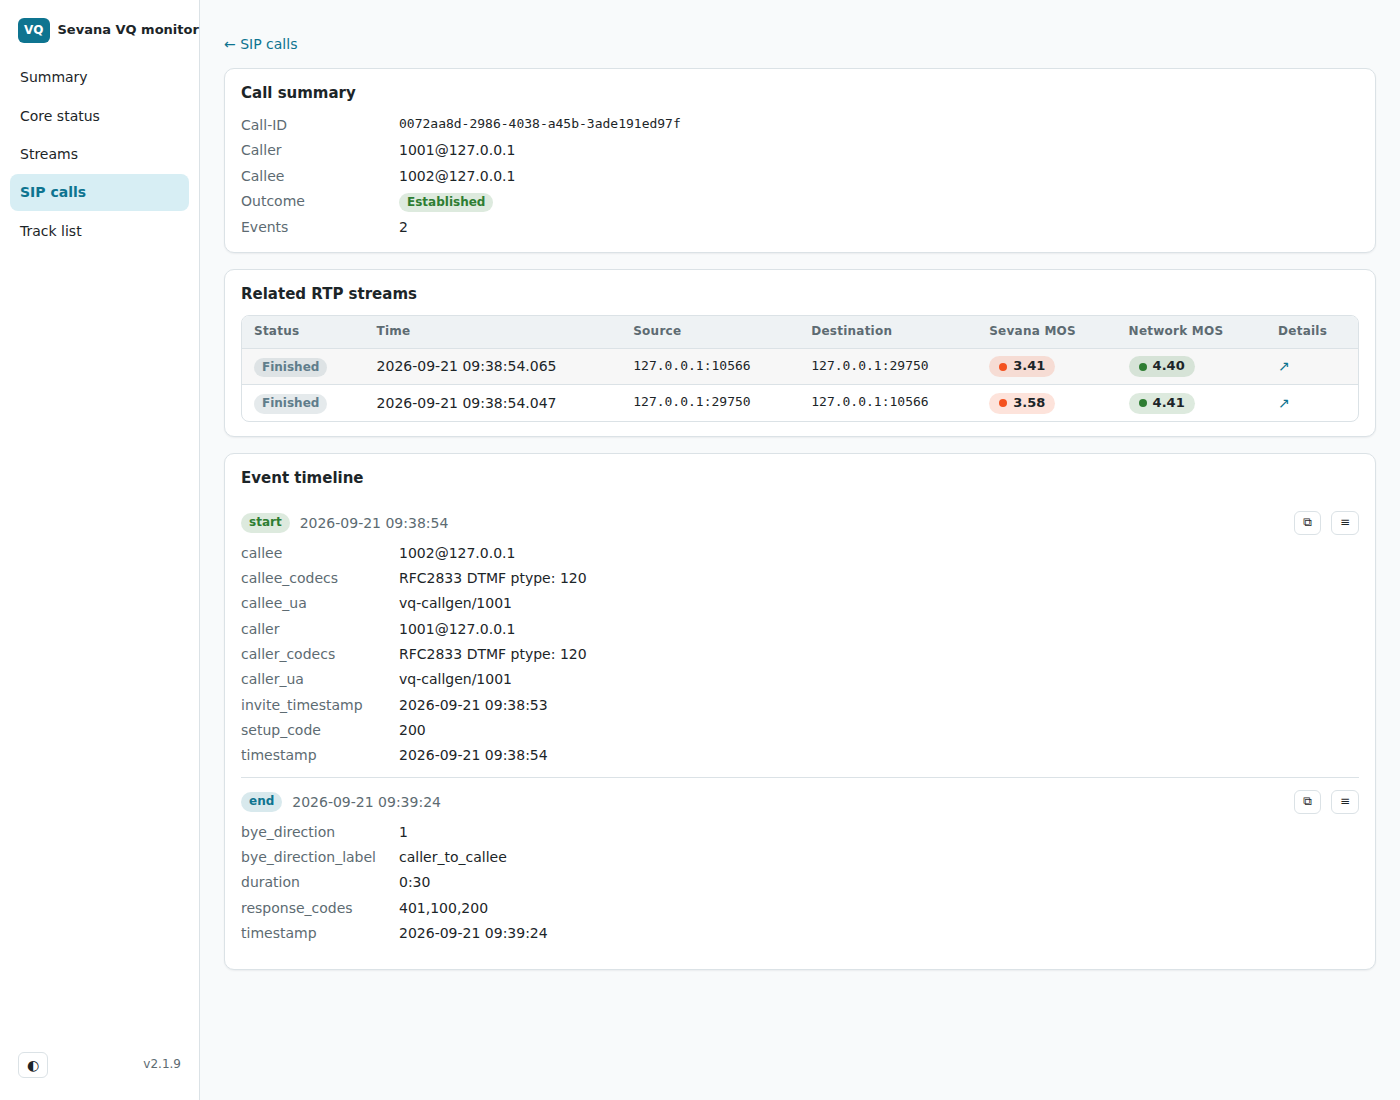
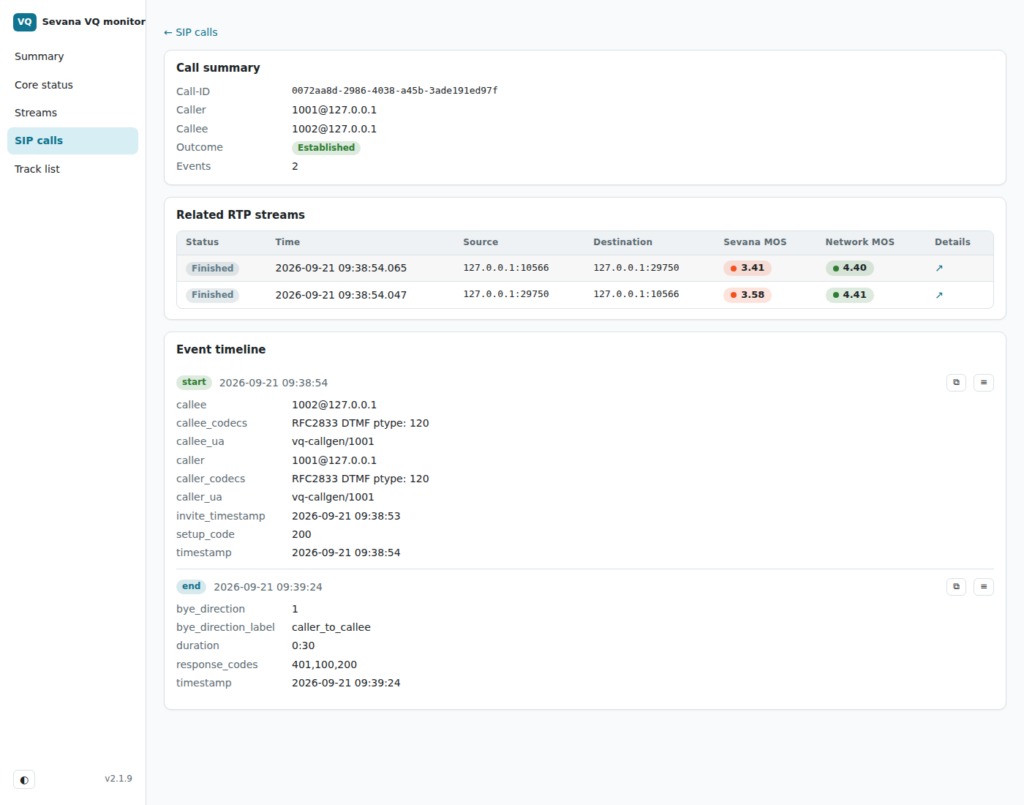
- SIP calls: every SIP dialog the PBX handled, with its outcome and final response code, and a timeline showing codecs, user agents and which side hung up.
Everything on the dashboard is also available as JSON or CSV through the documented REST API, so the data can feed your own reporting, NOC tools or billing checks.
Command line reference
vq show status |
Engine state and version, streams and SIP calls in progress, audio mode, capture counters per interface (including dropped packets) and dashboard process state |
vq show track |
The current track list |
vq track add | remove | clear |
Choose which calls get Sevana MOS and recording; applies to calls in progress |
vq db restart |
Restart the dashboard process only, for example after an upgrade; the PBX keeps running |
vq logger reload |
Reopen the engine log after rotation |
Requirements and deployment
| PBX | Asterisk 20 LTS with chan_pjsip on 64-bit Linux (built and verified on Ubuntu 24.04). Other Asterisk versions on request |
| Privileges | Asterisk needs the CAP_NET_RAW capability to capture packets; a systemd drop-in included with the module grants it |
| Capture | The interfaces that carry the PBX’s SIP and RTP, optionally limited to SIP and the rtp.conf port range. SIP over TLS cannot be parsed, so those streams are scored without caller and callee details. SRTP streams get network metrics only |
| Configuration | Three files in /etc/asterisk: vq_monitor.conf in Asterisk’s own INI format, plus the engine and dashboard YAML used by the standalone VQ Monitor |
| Storage | SQLite, with no external database. Statistics expire after a configurable period and audio after a separate one |
| Security | The dashboard listens on loopback only; publish it through a reverse proxy with authentication |
| Licence | A Sevana PVQA licence for perceptual scoring |
Module or standalone server?
Choose the Asterisk module when you run one or a few Asterisk PBXs and want quality monitoring without extra hardware, a SPAN port or a separate server. Choose the standalone VQ Monitor server for carrier links, SBCs and mixed networks: it captures mirrored traffic or HEP feeds, scales out with several probes feeding one database, and supports DPDK capture on multi-million packet-per-second links. Both use the same engine and Sevana PVQA scoring, so their results are directly comparable.
See your own PBX’s call quality
Want to see how your own Asterisk calls score? Book a guided demo of VQ Monitor for Asterisk, or talk to us about licensing.