Pcaptix turns a packet capture into clear VoLTE call quality analysis, and it handles ordinary VoIP just as well. From a .pcap or .pcapng file, it extracts the SIP and IMS signalling, reconstructs the RTP media, and decodes the audio, including the AMR-NB, AMR-WB and EVS codecs that carry VoLTE. Every stream then earns two complementary scores: Sevana’s perceptual MOS and a network-estimated MOS. Because Pcaptix ships as both a browser app and a native desktop build, you can triage a quick capture online or examine confidential subscriber traffic entirely offline.
Pcaptix Online DemoDownload for WindowsDownload for LinuxRequest a demo
VoLTE call quality analysis from a packet capture
Pcaptix links each RTP stream to its SIP dialog by SSRC and Call-ID, while standalone streams still get analysed on their own. For every stream, it decodes the negotiated codec, whether AMR-NB, AMR-WB or EVS on a VoLTE leg, or G.711, G.729 and Opus elsewhere, and then reports a dual MOS alongside R-factor, jitter, delay, packet loss and illegal-packet counters. Moreover, a 680 ms quality timeline marks each interval as OK, poor or uncertain, so you can export the detail to CSV for deeper work.
The main results (and benefits) are:
– Diagnoses bad calls in 30 seconds
– Automatic MOS and jitter analysis without Wireshark
– Find the cause of RTP degradation in one click
SIP/IMS and RTP extraction
Pcaptix reconstructs calls from .pcap and .pcapng, then links streams to dialogs by SSRC and Call-ID. Even standalone legs captured on an IMS core still receive full analysis.
VoLTE codecs decoded
The engine decodes AMR-NB, AMR-WB and EVS as well as G.711, G.729 and Opus. Therefore perceptual scoring works on real VoLTE media, not only on landline codecs.
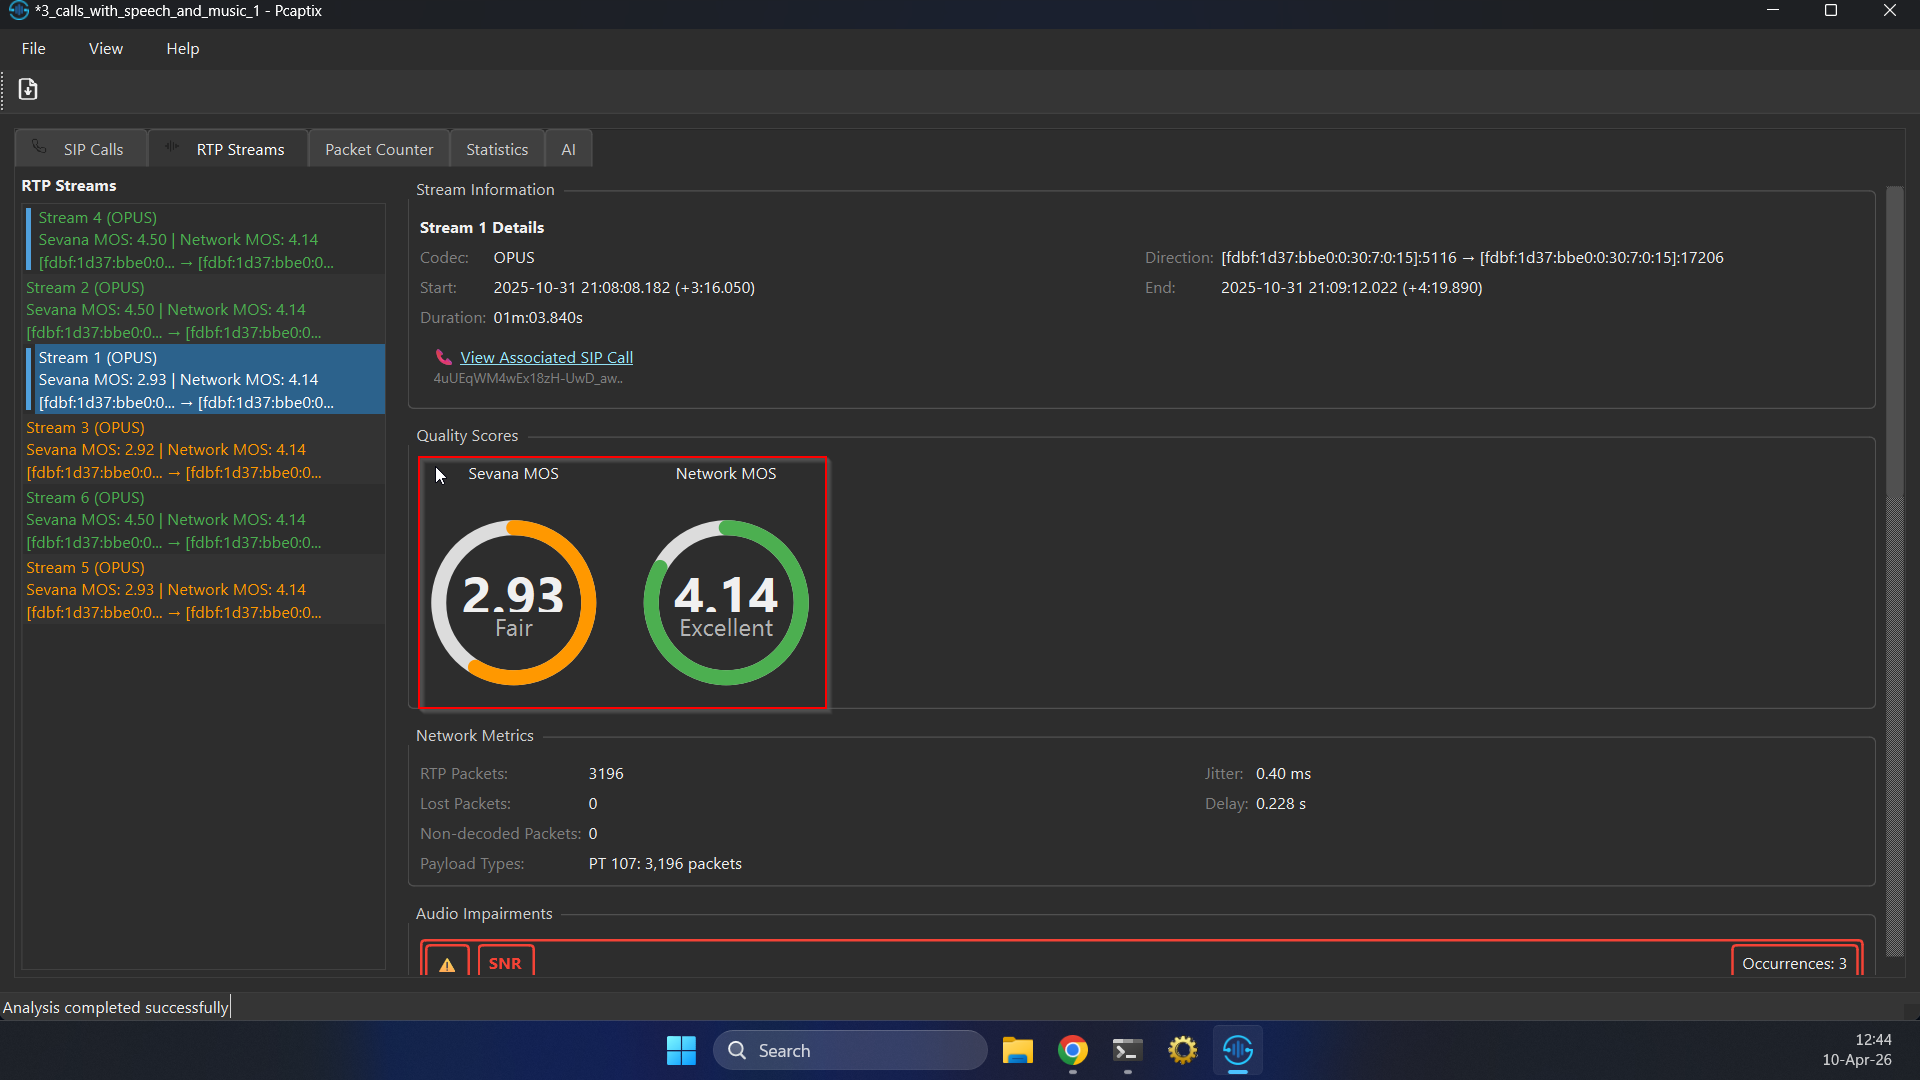
Dual MOS per stream
Sevana MOS reflects the decoded audio, whereas Network MOS estimates quality from loss, jitter and delay. Together, the two scores separate radio and transport faults from audio faults.
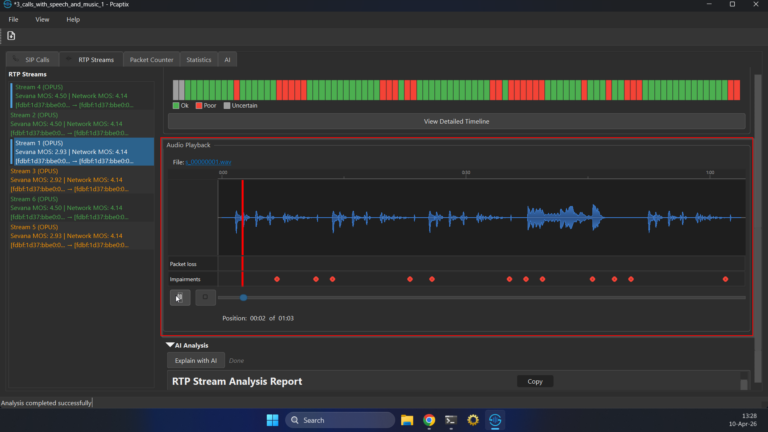
Impairment timeline and markers
A 680 ms timeline flags clipping, echo and noise, while the waveform marks DTMF tones, packet loss and impairments. As a result, you see exactly where a call went wrong.

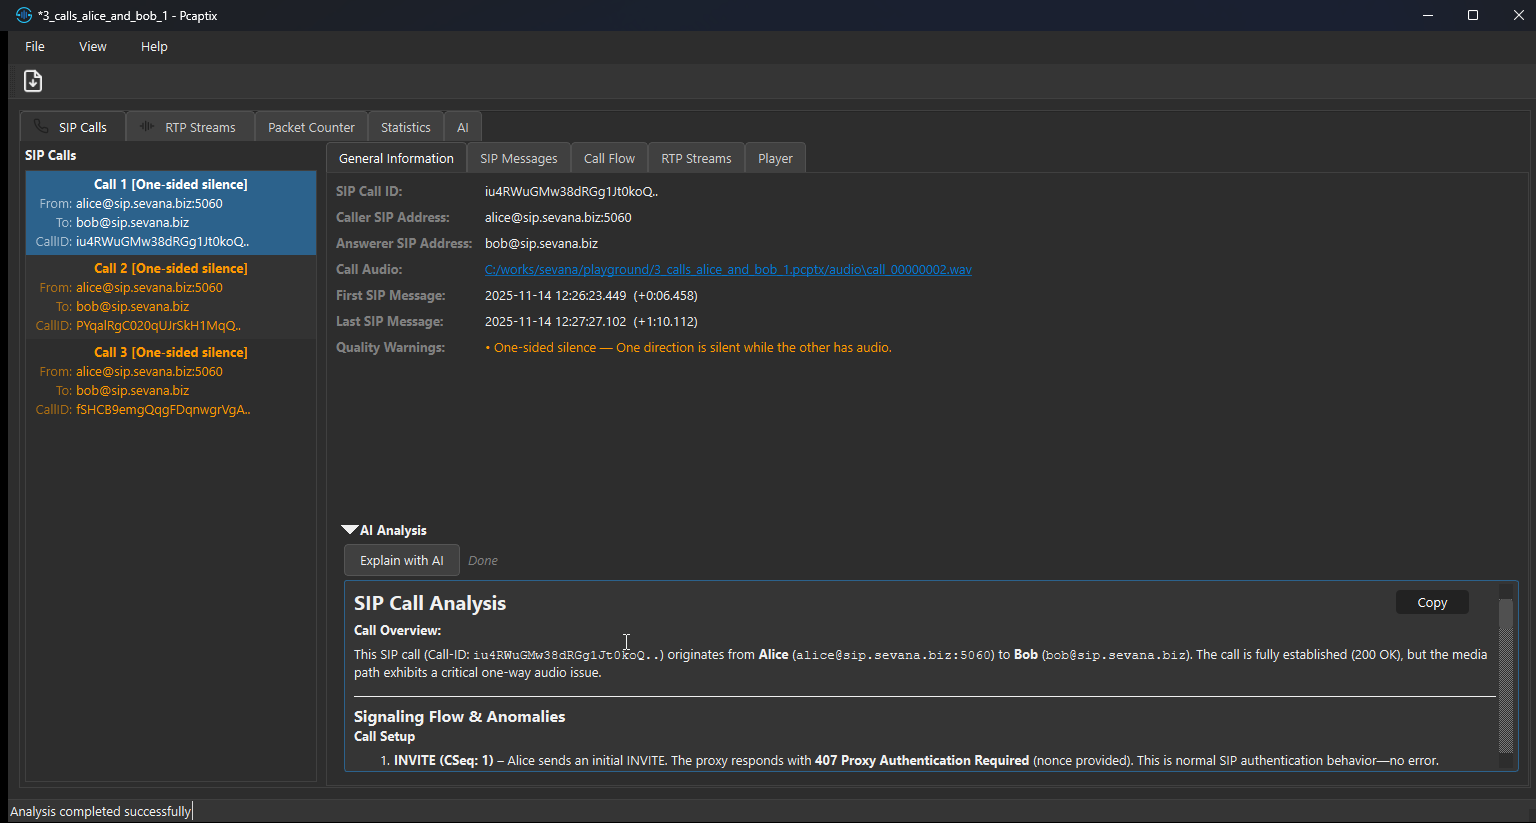
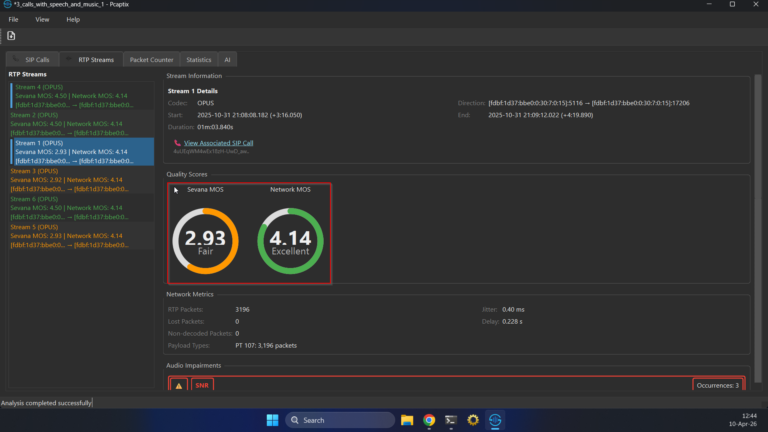
Inspect every VoLTE call and stream in depth
Select any stream and Pcaptix shows its codec, direction and timing, three MOS gauges, full network metrics, and the impairments it found. Below that, the embedded player draws the decoded waveform with three marker tracks: green for DTMF tones, orange-red for packet loss, and red for impairments. Consequently, a one-sided-audio or echo problem becomes obvious long before you open the audio.
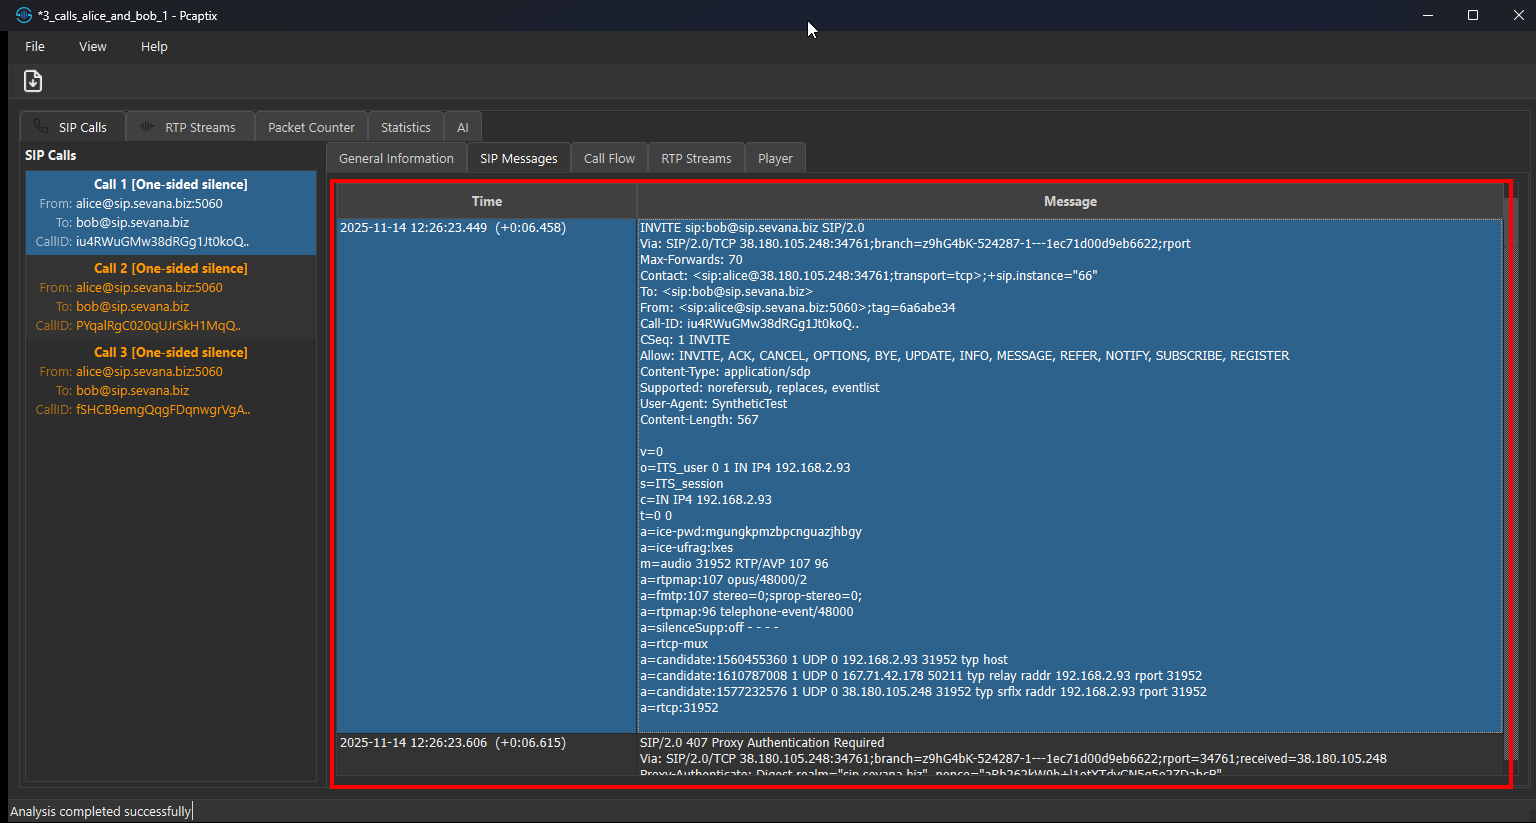
Follow the IMS signalling end to end
Open the Call Flow tab and Pcaptix lays out the signalling as a ladder between the discovered user agents and proxies, coloured by method and response class. If you need the raw exchange, the SIP Messages view lists every request and response with full headers and SDP, time-stamped against the capture. Together, these views make a failed registration, a codec mismatch or an authentication loop easy to spot.

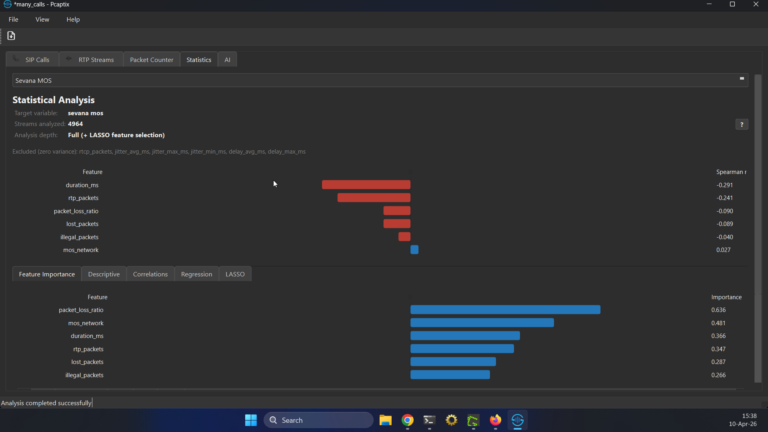
Cross-stream statistics that pinpoint the cause
Beyond per-stream detail, every analysis runs an aggregate pass across all streams in the capture. It answers one question directly: which network conditions actually hurt VoLTE quality here, and by how much? To do that, Pcaptix combines correlation, regression and LASSO feature selection, and it scales the depth to the sample size. Optionally, per-subnet grouping reruns the same pipeline for each IPv4 or IPv6 segment, so you can tell whether loss dominates one segment while jitter hurts another.
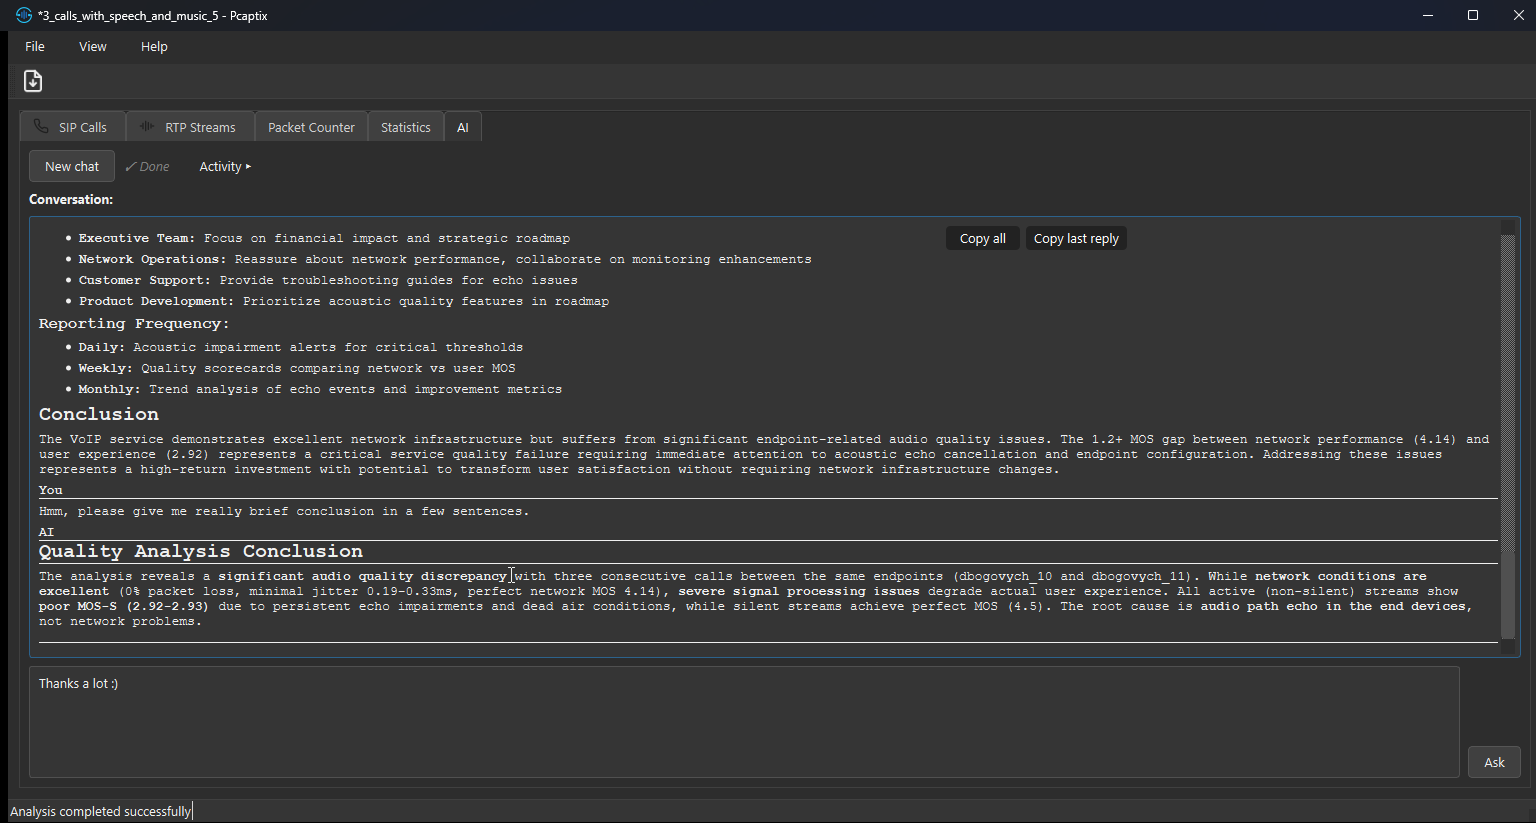
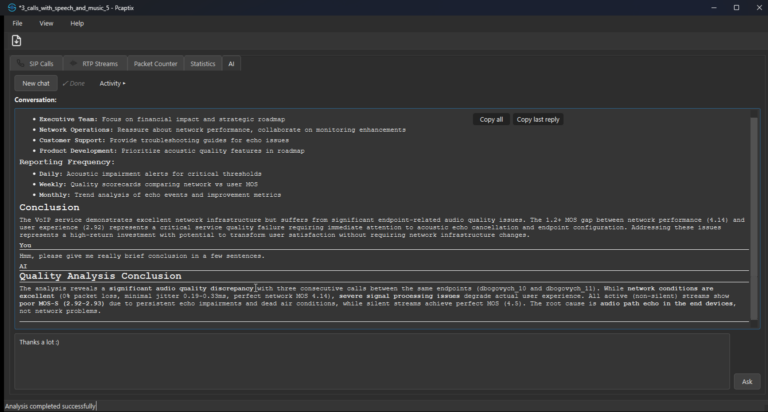
AI that explains the findings
An opt-in assistant turns the numbers into plain English. Ask it to summarise the report, then drill into a single stream or the statistics, and it keeps the context across your follow-up questions. For large reports above 100 KB, it switches to a tool-augmented workflow and fetches only the parts it needs. Because the endpoint, model and prompts are all configurable, you can keep the default Sevana-hosted model or point Pcaptix at any OpenAI-compatible backend, including a local one.
Desktop or web, the same engine
Both editions share Sevana’s vq_pcap engine and the same views: call flow, stream detail, dual MOS, timeline, waveform, markers, playback, and PDF or CSV export. The Web edition installs nothing, so it suits small captures, demos and quick sharing. By contrast, the Desktop edition removes the upload step and the size ceiling, which means parsing, decoding, MOS, statistics and the optional LLM all run locally, exactly what a mobile operator needs when a capture holds regulated subscriber traffic.
For continuous monitoring of live traffic rather than offline captures, see VQ Monitor; for the perceptual engine behind the scores, see Sevana PVQA. Both map their results to the ITU-T P.800 MOS scale.
Download Pcaptix and start your VoLTE call quality analysis
Grab the desktop build and analyse your own capture in minutes. The Windows installer and the Linux AppImage download free of charge, and both run without extra dependencies on Windows 10 or later and on Ubuntu 20.04+, Debian 11+ and compatible distributions. For commercial licensing or an online demo, simply get in touch.
Pcaptix Online DemoDownload for WindowsDownload for LinuxContact Sevana