VQ Monitor is Sevana’s server for real-time VoIP call quality monitoring on live networks. Crucially, it measures quality without sitting in the media path or touching your endpoints. The ITU-T G.107 E-model scores every stream, while Sevana’s PVQA perceptual analysis runs on the calls you select. As a result, you can finally tell network problems apart from audio problems instead of guessing.
VoIP call quality monitoring without touching your endpoints
VQ Monitor reads a mirrored (SPAN) copy of your production VoIP traffic, or HEP feeds from your SBCs and proxies. From there, it reports per-stream quality continuously. The E-model scores every stream it sees; however, perceptual scoring stays reserved for the calls you choose, because that is where the CPU cost lives.
Two MOS models per interval
Network MOS (G.107 E-model) covers transport quality, while Sevana MOS (PVQA) reflects perceived audio. Moreover, both appear in every per-stream and per-interval report.
Passive by design
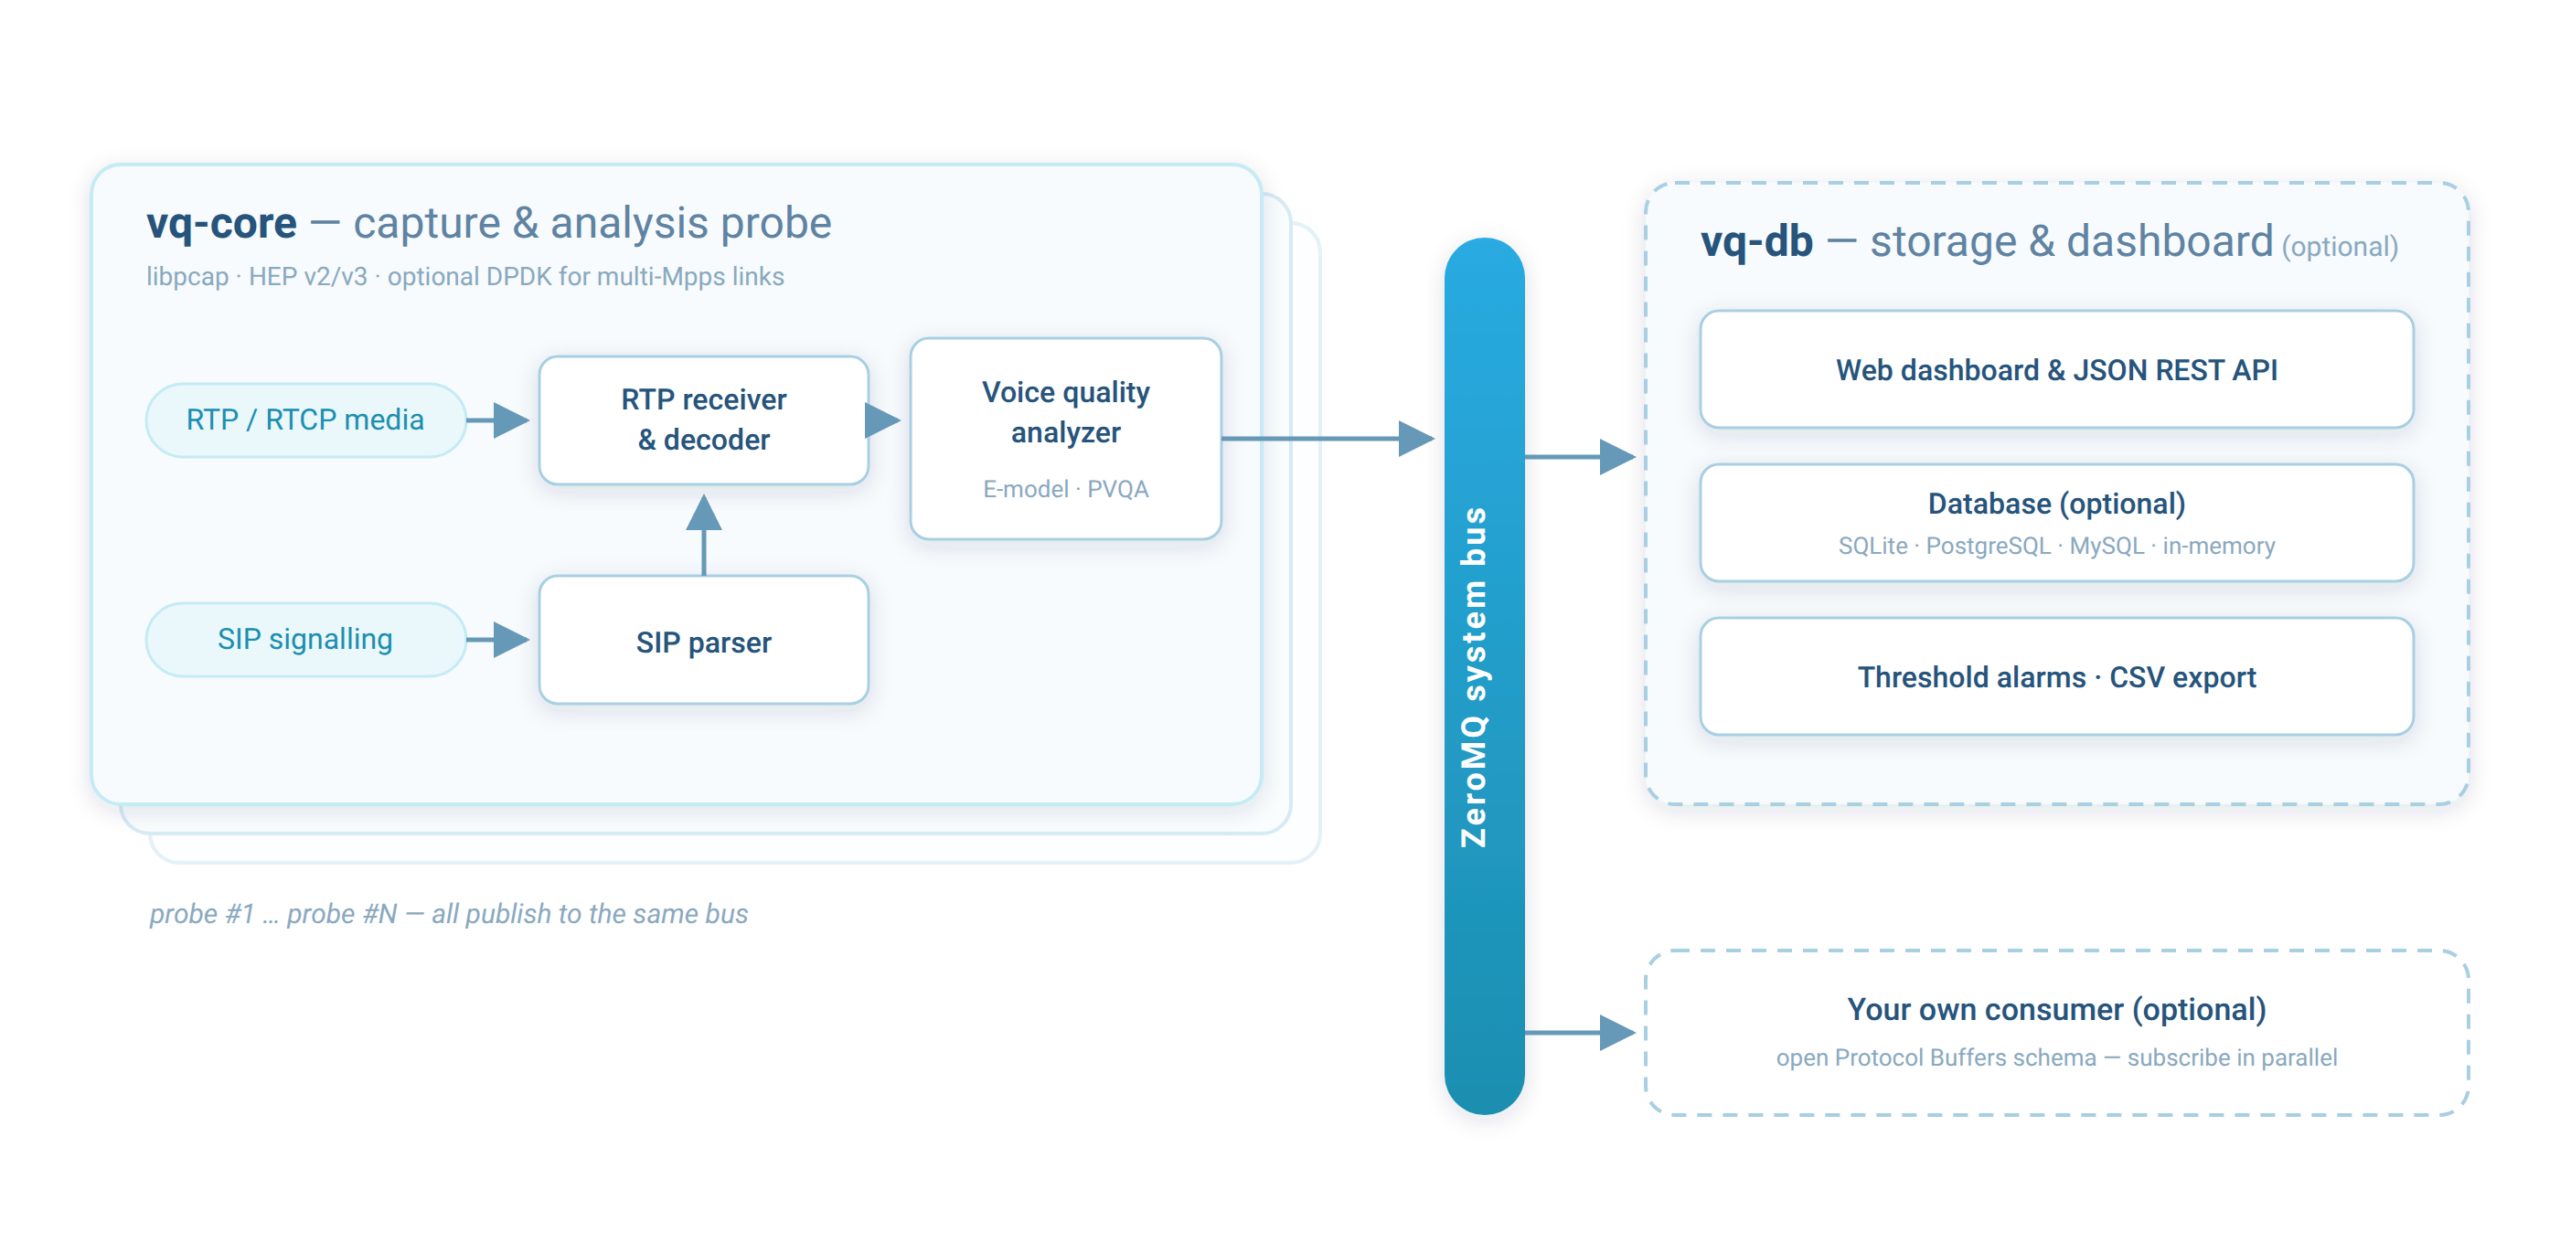
Capture uses standard libpcap or a HEP v2/v3 listener — no extra software needed; optional Intel DPDK covers multi-million-pps links. The server never injects packets into a call, so your endpoints stay untouched.
Handles encrypted media
SRTP handling is fully automatic: streams whose keys are unavailable still get complete network metrics, and when SIP carries SDES keys, VQ Monitor transparently decrypts the call and runs full PVQA analysis — nothing to configure.
Scales horizontally
Several capture probes can publish to one database over a ZeroMQ bus. Therefore, you simply add hosts instead of sharding a database.
How VQ Monitor works
The deployment splits into two cooperating processes. First, vq-core captures and decodes traffic, runs PVQA analysis, and publishes per-stream and per-interval reports on a ZeroMQ bus. Then the optional vq-db subscribes to one or more cores, stores the results, evaluates alarms, exports CSV, and serves the embedded web dashboard. Both ship as single static binaries with no runtime dependencies, so installation amounts to copying a file and a config. Only vq-core is mandatory; the bus speaks a fully documented Protocol Buffers schema and vq-db exposes a documented REST API (see Documentation), so you can replace or complement vq-db with your own consumer at any time.
Two quality scores that answer different questions
Network MOS (ITU-T G.107 E-model)
This simplified ITU-T G.107 E-model uses per-codec impairment values from G.113. Because it works from packet statistics alone, such as loss, jitter and round-trip time, it never depends on a successful audio decode, and it keeps working even when the media stays encrypted. Consequently, the CPU cost stays negligible, so VQ Monitor runs it on every stream.
Sevana MOS (PVQA)
Sevana’s PVQA algorithm works on the decoded PCM, locates intra-audio impairments such as clipping, echo, noise and dead air, and then predicts a MOS on the ITU-T P.800 scale. In short, Network MOS tells you what the transport delivered, whereas Sevana MOS tells you what the caller heard. On a clean call the two rarely disagree; however, when they do, the gap itself becomes the diagnosis.
Capture, signalling and codecs
The SIP capturer reconstructs call setup and correlates RTP addresses and SSRC values with SIP transactions. As a result, it tags each stream with its caller and callee URIs. For the streams you select, the decoder then turns the RTP payload into PCM and hands it to PVQA.
Supported codecs
G.711 (PCMA/PCMU)G.722G.729OPUSiLBCAMR-NBAMR-WBEVSGSM FRGSM HRGSM EFR
Carriers sometimes wrap AMR-NB, AMR-WB and EVS in IuUP frames inside RTP; fortunately, the decoder parses both layouts. In addition, you can switch off patent-licensed codecs at runtime and therefore avoid licensing exposure. For AMR and EVS streams the RTP payload headers also yield DTX/SID silence statistics, even when the audio itself is never decoded.
SIP call analytics, not just media metrics
Beyond per-stream quality, VQ Monitor reconstructs the SIP call lifecycle itself. Every established call is recorded with its post-dial delay (INVITE to answer), every failed call with its outcome — rejected, canceled or timed out — together with the final SIP response code, and every mid-call reINVITE or UPDATE (hold/resume, codec renegotiation) with the renegotiated media details. Because each RTP stream is tagged with its SIP Call-ID, the dashboard and the API let you move in both directions: from a call to all of its media streams, and from a poorly scoring stream back to the signalling timeline that produced it. Consequently, “the audio was bad” and “the call never set up” finally live in one tool.
Call health: problems you only see by comparing both directions
Some of the most common VoIP complaints never show up in a per-stream score: each direction looks fine on its own, yet the call fails. After every call ends, vq-core compares the call’s RTP streams with each other and attaches call health warnings to the SIP call. They appear as warning chips in the dashboard’s SIP call list and on the call detail page, in the REST API, and as an event on the ZeroMQ bus for your own tools.
| Warning | What it catches |
|---|---|
| One-way audio | Only one direction carried RTP, typically because of NAT, a firewall or a wrong address in the SDP. |
| One-sided silence | Both directions carry packets, but one of them carries only silence: a muted or broken microphone, or a media server that never plays its prompt. Detected by PVQA’s silence analysis on the calls it analyses. |
Codec mismatch (Codec asym) |
The two directions use different codecs, for example G.711 µ-law one way and A-law the other. |
Packetization mismatch (Ptime asym) |
The two directions use different packet times (ptime), for example 20 ms against 40 ms. |
Payload type mismatch (Payload asym) |
The same codec, but a different RTP payload type number in each direction. |
Duration mismatch (Duration asym) |
One direction stopped long before the other: one side may have dropped mid-call. |
| Late media | One direction started more than half a second after the other, so the first words were lost. |
The thresholds are configurable. A healthy call is explicitly marked “No problems found”, so a checked call is never confused with one that was not judged. A stream that carries only silence is also flagged in the stream list on its own.
Dashboard, API and alarms
For day-to-day VoIP call quality monitoring, the vq-db dashboard lists active and finished streams together with their Sevana MOS, Sevana R-factor, Network MOS, jitter and SIP addresses. From any row, you can drill down to single-stream and per-chunk PVQA detail. Each stream also carries round-trip time, min/max/average envelopes for jitter and both MOS scores, detected echo peaks, and DTX/SID silence counters. Moreover, everything the dashboard shows — streams, SIP calls, live and historical summaries — is also available as JSON or CSV through a fully documented REST API (see Documentation), so it feeds straight into your own tooling.
Finally, threshold alarms watch a counter over a time window you choose — Sevana MOS, R-factor, Network MOS, packet loss, jitter, call duration, the share of silent streams, of failed calls or of calls with a call health warning such as one-way audio, packets dropped at capture, or free disk space — and run a shell command or call a webhook when it crosses your limit, again while it stays crossed, and when it recovers. A rule can be narrowed to particular calls with the dashboard’s filter language, and the dashboard’s Alarms page shows every rule’s state and the latest alarms. Data retention is equally configurable: stream records and decoded audio age out on independent lifetimes, or the database can run entirely in memory with bounded retention when you only care about the live picture.
Tuning for high-volume probes
These knobs matter most on a busy link, in roughly the order you should reach for them:
- Choose which calls deserve PVQA. A runtime-controlled “track list” of SIP addresses decides which calls get full perceptual analysis, and a process-wide cap bounds the audio workload; everything else still gets Network MOS. Because audio decoding dominates CPU, this single lever drives most of your budget.
- Optionally filter at the capture stage. UDP port-range and illegal-stream filters keep spurious traffic off the worker threads — the biggest saving on a busy 10G mirror. Plain libpcap is all a probe needs; for multi-million-packet-per-second links, optional Intel DPDK capture takes over at line rate, and per-NIC drop counters prove whether any loss happened before the probe ever saw the packet.
- Optionally separate storage from capture. Run
vq-dbon its own host and let several probes publish into it; the ZeroMQ feed then scales close to linearly.
Requirements and deployment
| Operating system | Any modern 64-bit Linux; both binaries link statically, so they need nothing beyond the licence and config files |
| CPU | Any modern x64 Intel/AMD; multi-core helps because decoding and PVQA run hot under load |
| Memory | 1 GB covers testing and low volume, while busy aggregation links need only a few KB per active stream |
| Network | A mirrored or SPAN interface for DPDK live capture (multi-million PPS capable); a normal NIC is ok for libpcap / HEP-only deployments |
| Database | None required; SQLite ships by default, an in-memory mode with bounded retention avoids disk entirely, and PostgreSQL or MySQL suit multi-agent installations |
Documentation
The full product documentation is available as PDF — including the two open integration specifications, so your own tooling can consume the same data the bundled dashboard does:
- VQ Monitor — product documentation (PDF) — architecture, configuration reference, deployment and tuning
- vq-core ZeroMQ bus API (PDF) — the Protocol Buffers event schema every subscriber can consume
- vq-db REST API (PDF) — endpoints, filter grammar and response shapes
See VoIP call quality monitoring on your own traffic
Want to watch quality on your own network in real time? Simply book a guided demo of VQ Monitor, or talk to us about licensing.


